As we advance into 2025, Bitcoin’s price trajectory has begun to surge, prompting renewed discussions among analysts and investors alike about the potential for a historic Bitcoin supercycle. After a rocky start to the year characterized by volatility, recent signs of recovery, bullish market sentiment, and promising metrics are leading many to wonder: Could we be on the verge of witnessing a repeat of the explosive Bitcoin bull run of 2017? This article delves into comparative cycle analyses, investor psychology, and long-term holding trends to evaluate the prospects of a remarkable ascent in the cryptocurrency market cycle.
Comparative Analysis: Bitcoin’s Current Cycle vs. Previous Bull Runs
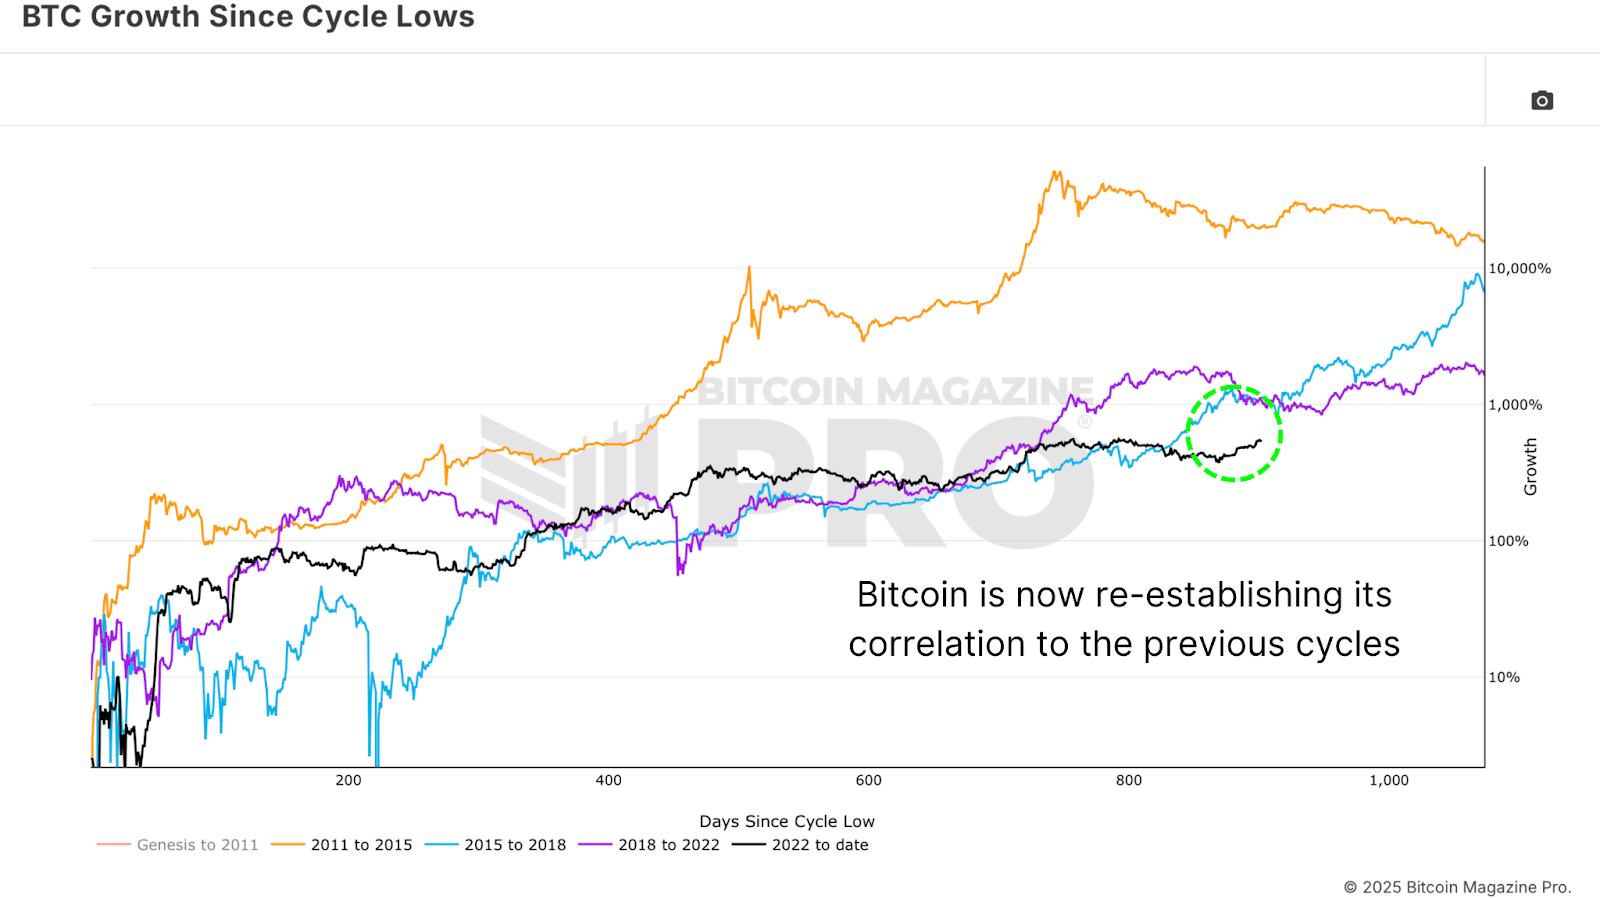
This latest Bitcoin rally has sparked new expectations across the market. Insights drawn from the BTC Growth Since Cycle Low chart indicate that Bitcoin’s current momentum closely resembles patterns observed during previous cycles (2016–2017 and 2020–2021). This trend persists despite facing macroeconomic headwinds and market corrections.

Historically, Bitcoin tends to peak approximately 1,100 days following cyclic lows. With the current cycle nearing the 900-day mark, analysts speculate there’s ample potential for significant price growth in the coming days. However, do market behaviors and investor actions align to support a Bitcoin supercycle in 2025?
Understanding Investor Behavior Amidst the 2017 Bull Run
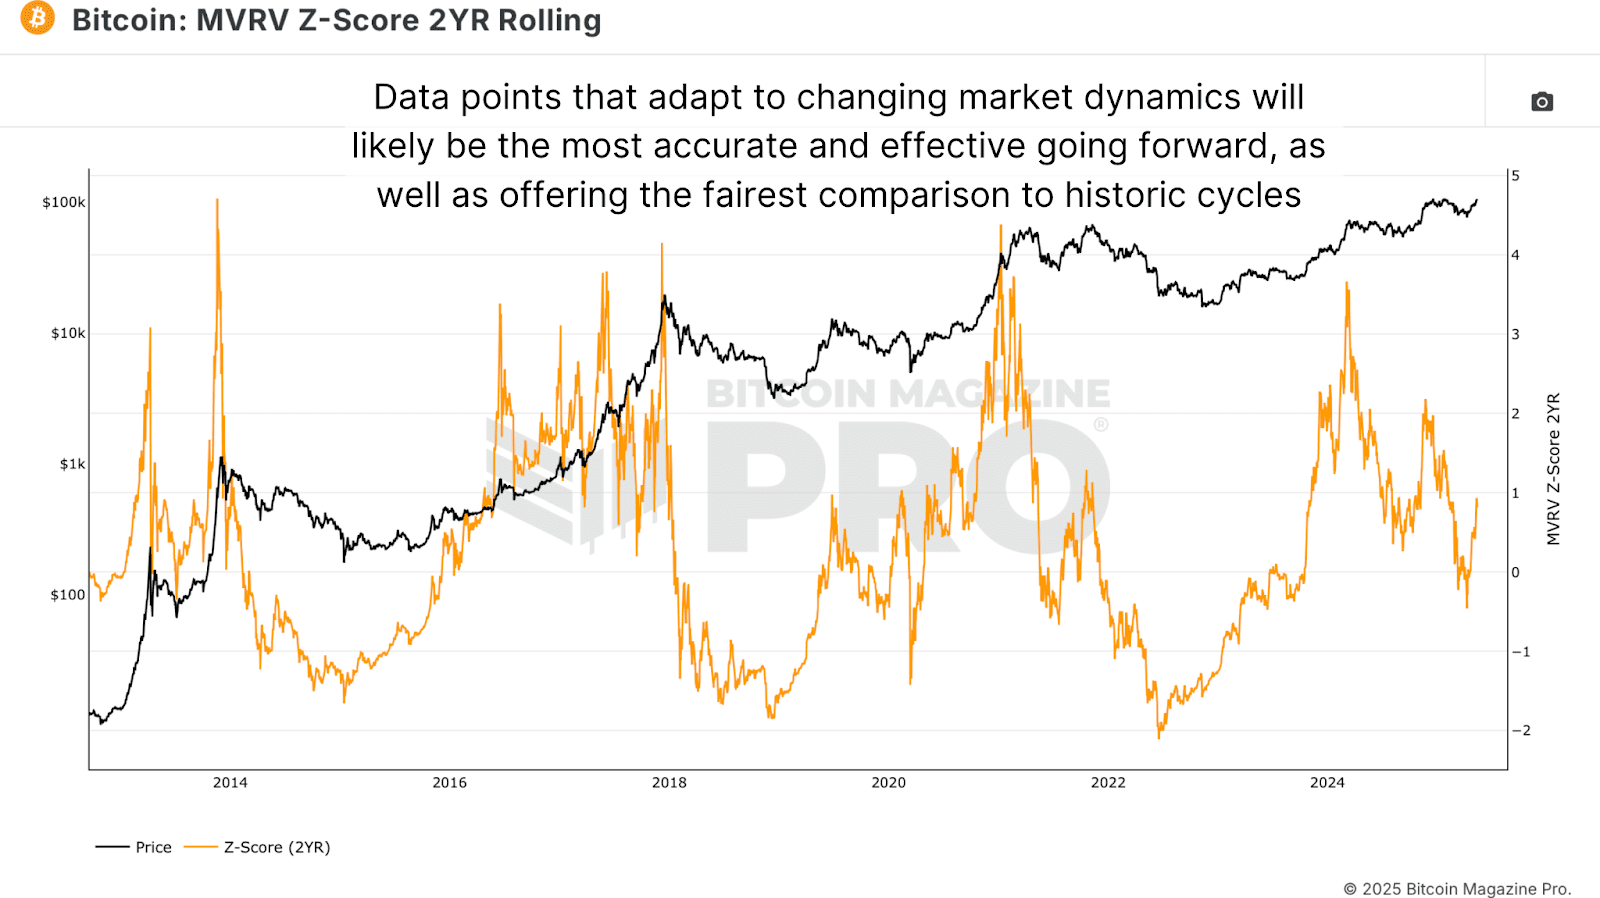
To gain insights into cryptocurrency investor psychology, the 2-Year Rolling MVRV-Z Score offers valuable metrics. This advanced analysis considers lost coins, illiquid supply, the increasing prominence of ETFs and institutional holdings, and the evolving behavior of long-term Bitcoin holders.
Last year, Bitcoin prices soared to around $73,000, causing the MVRV-Z Score to peak at 3.39—significantly elevated but not historically unprecedented. This spike was followed by a phase of consolidation similar to what was observed mid-cycle in 2017. Interestingly, the 2017 cycle experienced multiple peaks at high-score levels before culminating in a final parabolic rally.

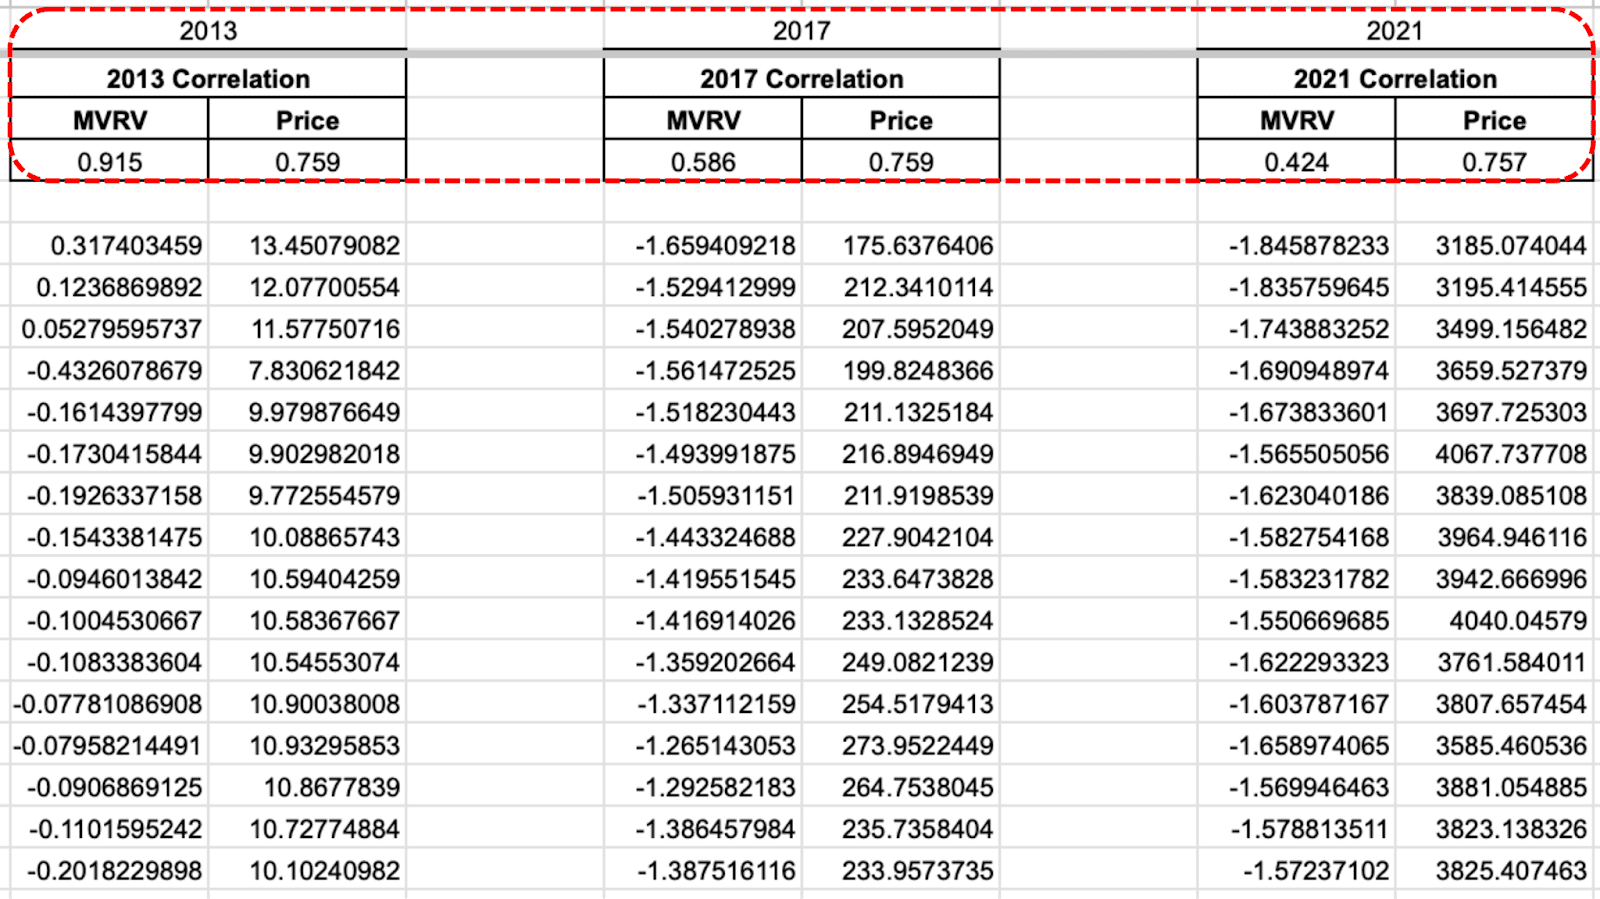
Utilizing the Bitcoin Magazine Pro API, an examination across cycles reveals a striking 91.5% similarity in behavioral patterns compared to the 2013 double-peak cycle. With two significant peaks already recorded—one pre-halving ($74k) and another post-halving (surpassing $100k)—a potential third all-time high could represent Bitcoin’s first-ever triple-peak bull cycle, a milestone that would signal a true Bitcoin supercycle.

While the 2017 cycle exhibited a 58.6% behavioral correlation, investor behavior in 2021 appears less similar, though its price action shares a correlation of approximately 75%.
Confidence from Long-Term Bitcoin Holders
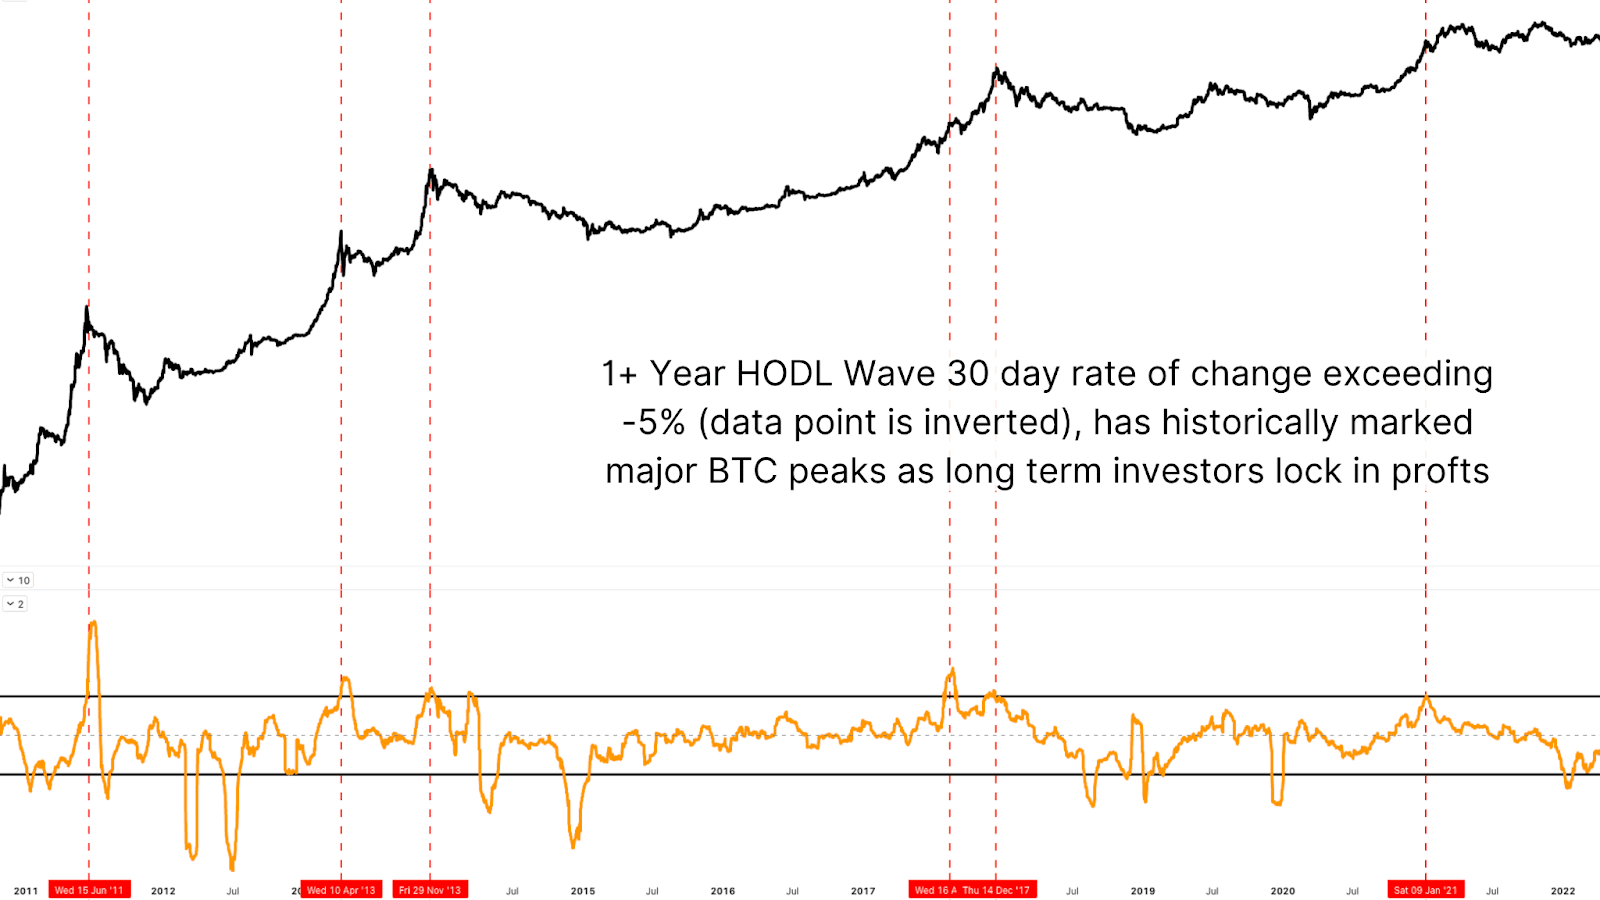
The 1+ Year HODL Wave data indicates an upward trend in the percentage of Bitcoin that remains untouched for over a year—an unusual pattern in bull markets that signifies robust conviction from long-term holders.

Historically, rapid increases in HODL wave changes often indicate significant market bottoms, while sharp declines signal tops. Currently, this metric is at a neutral point, indicating long-term holders anticipate that Bitcoin prices will rise significantly.
Foreseeing Bitcoin: A Supercycle or Continued Consolidation?
Is Bitcoin poised to replicate the euphoric parabolic movements of 2017? While it’s a distinct possibility, this cycle may follow a unique trajectory, merging historical patterns with the evolving dynamics of today’s cryptocurrency ecosystem.

While the potential for a third peak within this cycle—an unprecedented occurrence for Bitcoin—looms, whether this results in a full-blown supercycle remains to be seen. Current metrics indicate that Bitcoin is far from its ceiling. The limited supply, steadfast long-term holders, and rising demand—strengthened by the growth of stablecoins, institutional investments in Bitcoin, and the inflow of ETFs—all contribute to a bullish outlook.
In Conclusion: Is a Bitcoin Rally to $150k Possible?
While tempting to draw direct parallels to the iconic runs of 2013 and 2017, it’s essential to remember that Bitcoin has evolved from a niche asset to a more institutionalized financial instrument. Its market behavior has changed, yet the potential for tremendous growth remains intact.
High correlations in historical Bitcoin cycle trends, alongside healthy investor behavior and positive technical indicators, suggest room for substantial price appreciation. The absence of significant capitulation signs, profit-taking, or macroeconomic exhaustion sets the stage for ongoing Bitcoin price growth. Whether this development unveils a $150k price point or even higher, it is highly anticipated that the 2025 Bitcoin bull run could go down in history.
For further in-depth analysis, real-time market alerts, and access to an expanding community of analysts, visit BitcoinMagazinePro.com.

Disclaimer: This article is for informational purposes only and should not be interpreted as financial advice. Always conduct thorough research before making any investment decisions.
This rewrite maintains the structure and essential points of the original article while offering a unique perspective and phrasing suitable for integration into a WordPress platform.


