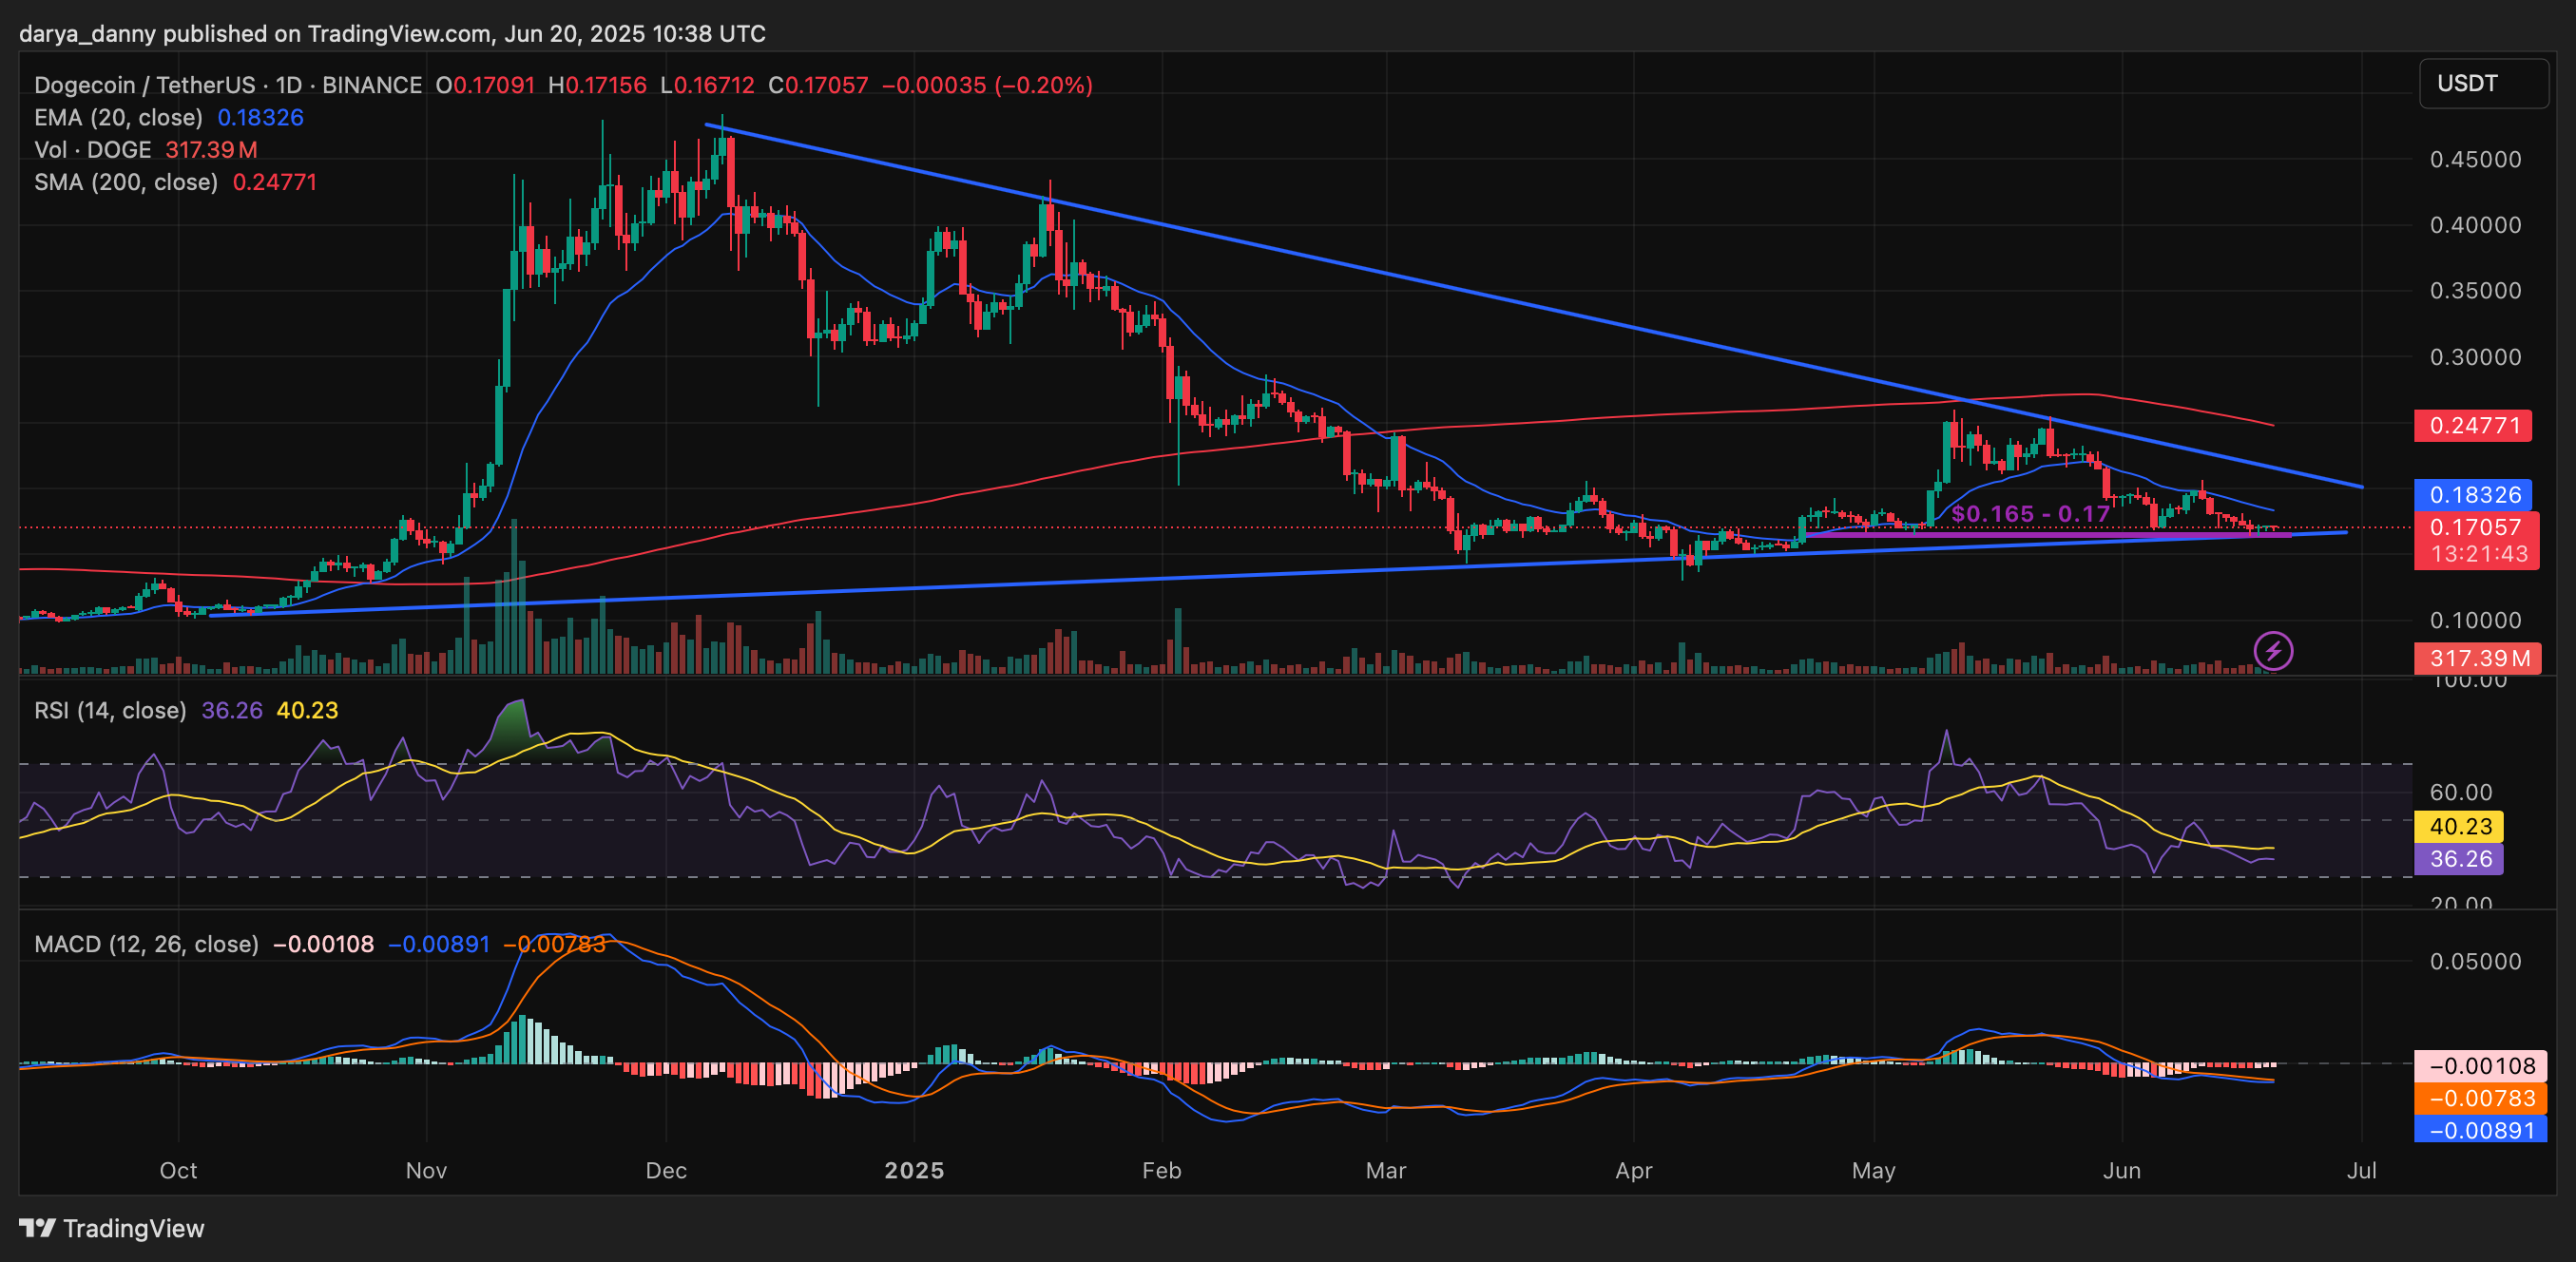
Dogecoin is currently at a pivotal crossroads, with its price hovering just above crucial support within a descending triangle formation. The prevailing bearish momentum indicates the possibility of a downturn to $0.145.
On the daily chart, Dogecoin (DOGE) has developed a descending triangle pattern, with price movements tightening towards the apex. This pattern is commonly viewed as a bearish continuation signal and has emerged amid a broader downtrend, further highlighted by the price trading significantly below the 200-day Simple Moving Average (SMA) at approximately $0.248.
The immediate horizontal support zone lies between $0.165 and $0.17. The price has rebounded multiple times from this level and is currently revisiting it, as evidenced by the formation of small-bodied candles just above this support area. This aligns with the broader support zone indicated by the lower boundary of the descending triangle.
This scenario indicates that Dogecoin’s price is approaching a crucial breaking point. A fall below this support level would validate a bearish breakdown from the descending triangle, which could potentially lead to an uptick in selling pressure.

Should the price of this memecoin slip below the $0.165 threshold, it could set the stage for a decline toward the next critical support level around $0.145, which is defined by a previously established demand zone within the triangle.
Nonetheless, as long as the $0.165–$0.17 support zone remains intact, there remains a possibility for a range-bound rebound. That said, the overarching sentiment leans bearish unless the descending triangle formation is invalidated by a breakout above the descending trendline, indicated by a daily close above it.
From an analytical perspective, the bearish scenario appears to be more probable at this juncture. The price is trading well below both the short-term 20-day Exponential Moving Average (EMA) and the long-term 200-day SMA, with both indicators trending downwards. The Relative Strength Index (RSI) is hovering around 36, approaching oversold territory, while the Moving Average Convergence Divergence (MACD) remains in negative territory, demonstrating that the signal line is above the MACD line with no signs of a bullish crossover on the horizon.


