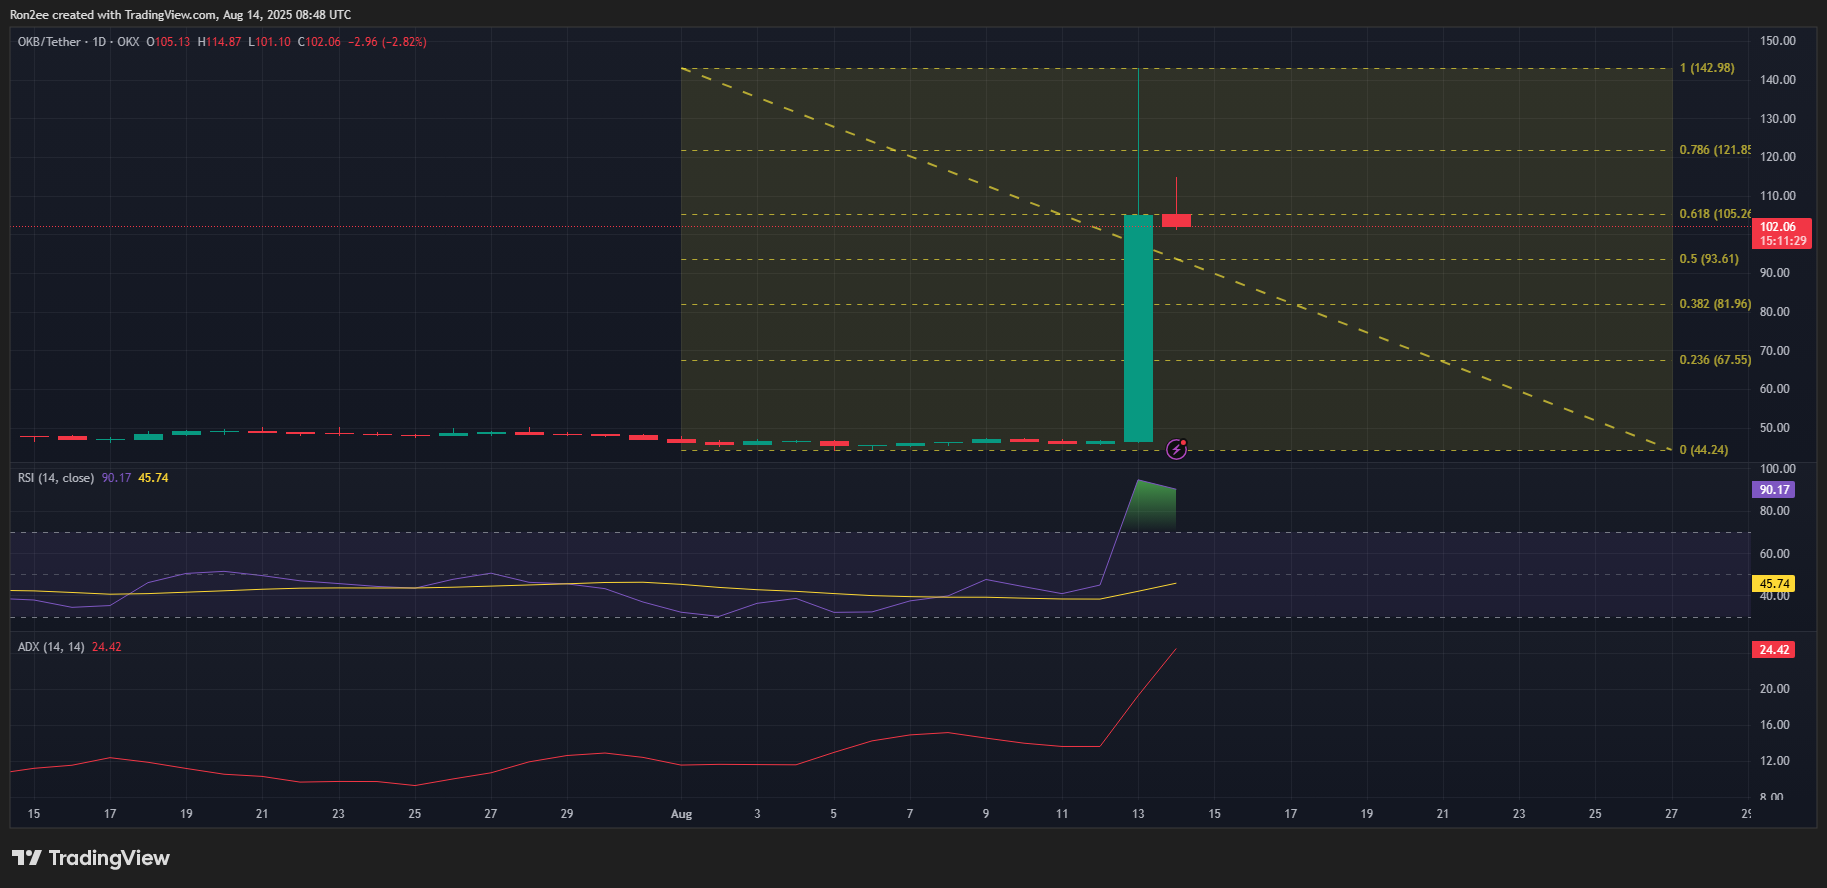
The OKB token may face a downward correction following an impressive 200% rally, with negative market sentiment and whale sell-offs casting a shadow over its recent gains.
Summary
- OKB soared nearly 200% to reach an all-time high of $125.88, before retracting to $104.4, reflecting a shift towards bearish outlooks.
- Data from Santiment indicates a marked negative sentiment and a rise in short positions among traders.
- Fibonacci analysis pinpoints $81.96 as a crucial support level amidst current trading activities.
As reported by crypto.news, OKB (OKB), the cryptocurrency associated with the OKX exchange, surged nearly 200% to a peak of $125.88 on August 13, culminating in a market capitalization of $7.4 billion at that moment. However, the token has since retraced some of its gains, trading around $104.4 at the time of writing. This decline in value is likely to continue as the market sentiment shifts towards the negative.
Santiment’s latest analytics reveal that the weighted sentiment surrounding OKB has dipped further into the negative spectrum, suggesting that investor sentiment is increasingly shifting toward expecting a price correction.
Additionally, the weighted funding rate in the futures market has turned negative, signifying a surge in traders opting to position themselves short, anticipating further price declines.

The recent offloading of holdings by whale investors is contributing to this bearish trend. Data indicates a significant decrease in the number of whale addresses holding between 10,000 and 100 million OKB tokens following the token’s meteoric rise.
This sell-off from large stakeholders could incite panic among retail investors, who often mimic the moves of these high-net-worth individuals. If large holders continue to reduce their positions, this could initiate a larger wave of selling pressure across the market.
Such sell-offs are fairly common in the cryptocurrency landscape, particularly following a new all-time high, as early investors often choose to realize profits. This could further exacerbate declines in OKB’s price, especially in the context of a broader market downturn as the cryptocurrency space approaches a peak in volatility.
OKB Price Analysis
A review of the daily chart for OKB reveals a lack of distinct patterns since its recent rally, which followed months of sideways trading within the $34-$65 range throughout early 2023.

The Relative Strength Index (RSI) has shown bearish divergence after peaking in the overbought range at 95 and then retreating to 91. Although this indicates a slight pullback, the RSI remains within overextended territory, highlighting the risk of a further correction.
The Average Directional Index (ADX), currently at 24, suggests a potential reversal is developing, but it lacks full strength; a reading above 25 would indicate that the reversal is gaining traction.
Key Fibonacci retracement levels suggest that significant support is found at $81.96, which corresponds with the 38.2% retracement level. A decisive breach below this threshold could pave the way for a deeper decline toward $44.20, aligning with long-term support metrics.
In contrast, should buying pressure materialize and OKB bounce back from the $81.96 level, it might signal the onset of another upward move for the token.
The next few days will be crucial in ascertaining whether OKB can consolidate at elevated levels or if it will witness an unraveling of its recent gains as post-rally momentum dissipates.
Disclosure: This article does not represent investment advice. The content and materials featured on this page are for educational purposes only.


