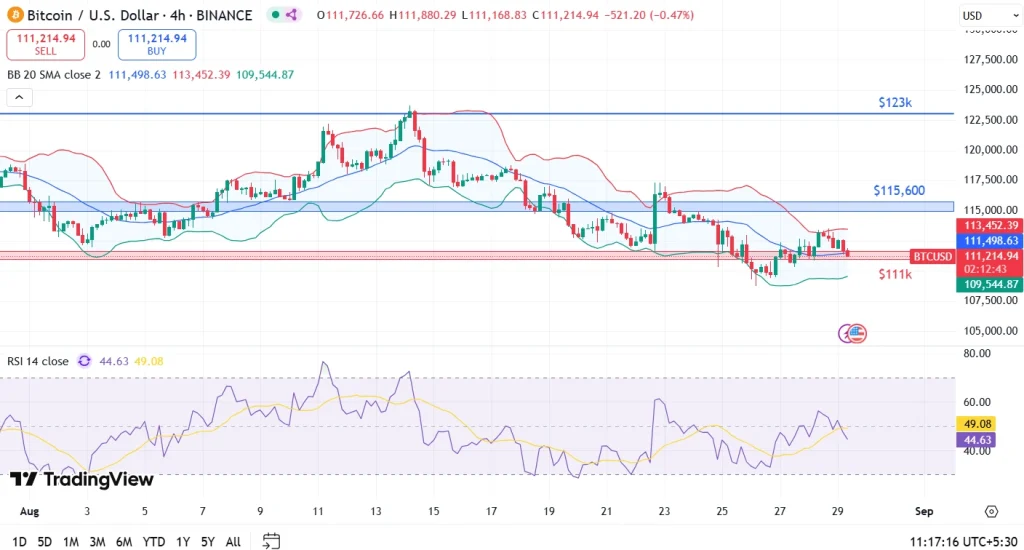
Bitcoin’s price has recently dipped to approximately $111,000, experiencing a 1.39% decline in the past 24 hours. With a market capitalization of $2.21 trillion, the trading volume has decreased by 8.28%. Currently, BTC is navigating significant support levels after struggling to maintain its 7-day and 30-day Simple Moving Averages (SMAs), which amplifies the potential for increased selling pressure.
While the current downturn of 11.4% from its all-time high (ATH) appears modest compared to Bitcoin’s historical fluctuations, on-chain metrics and broader economic factors suggest underlying vulnerabilities.
On-Chain Insights
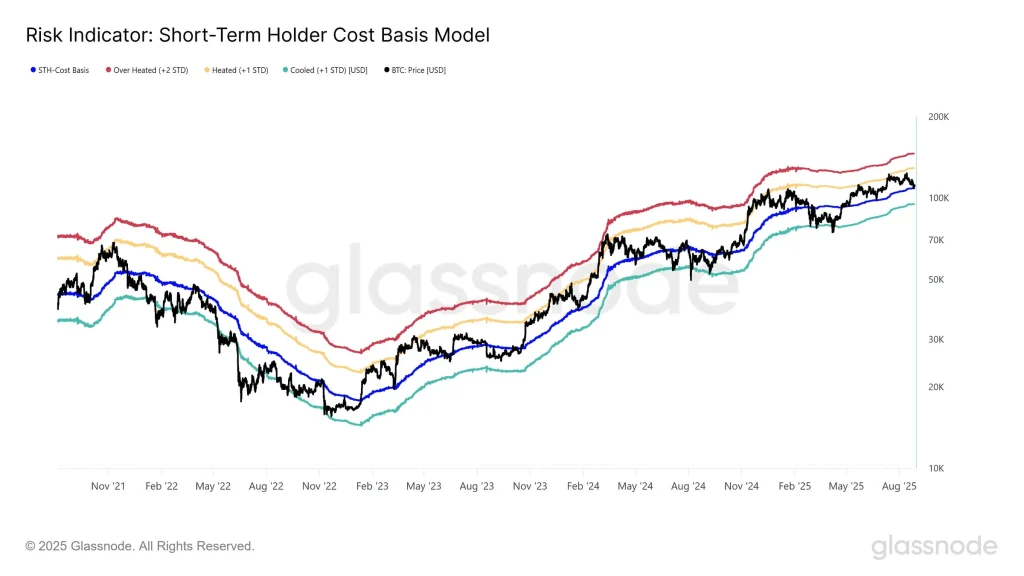
According to Glassnode, Bitcoin is trading just below the short-term holder cost basis of approximately $108.9k. Historically, prices dipping below this threshold have foreshadowed multi-month bearish trends. Should BTC fail to sustain around the $107k to $108.9k range, statistical models suggest that a mid-term bottom might materialize between $93k and $95k.

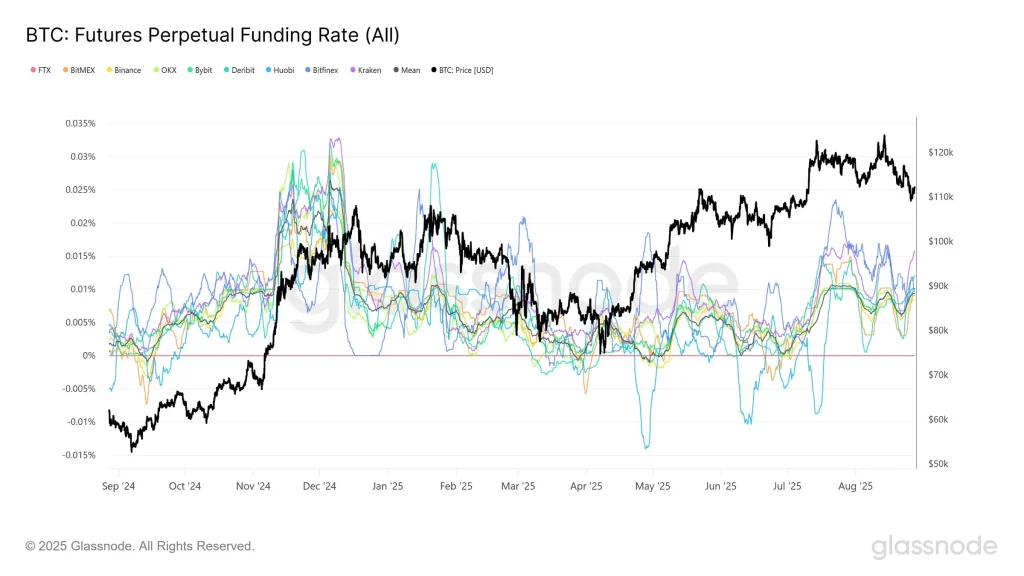
While the recent pullback remains relatively moderate—previous mid-cycle corrections have exceeded 25%, often due to severe capitulation events that slashed prices by over 75%—this small drop does not indicate widespread panic selling. However, a lack of robust spot demand coupled with the precarious state of perpetual contracts around a 0.01% funding rate raises concerns. Traders attempting to “buy the dip” appear hesitant, leaving the market vulnerable to abrupt shifts in sentiment.

Compounding the situation, large Bitcoin transfers have been observed across exchanges this week, including a significant 330 BTC (approximately $39 million) movement from a wallet that had been dormant for 12.3 years along with repeated deposits ranging from 4,000 to 6,000 BTC to Coinbase. While such inflows do not automatically equate to immediate liquidations, they increase the available supply on trading platforms. The Exchange Whale Ratio has surged to 0.50, historically indicating near-term price weakness.
BTC Price Analysis
On a technical level, Bitcoin’s drop below the 7-day SMA at $113,057 and the 30-day SMA at $115,600 has ignited bearish momentum. The MACD histogram indicating –568.92 and an RSI of 44.6 further reinforce a downward trend. Bitcoin is currently hovering around the 78.6% Fibonacci retracement level at $112,120. A breach at this point would increase the likelihood of a decline toward $108,762, identifying $107k as a crucial support line.

A recovery back to $113.6k is plausible but is likely to face resistance from short-term holders eager for exit liquidity. If the bulls do not quickly regain control, the chances of a slide toward the $93k to $95k range become increasingly realistic.
FAQs
This range aligns with the short-term holder cost basis. Trading below this level for an extended period may signal the onset of deeper corrections.
Indeed, if Bitcoin fails to hold around $107k, historical cycles and risk assessments indicate a potential mid-term bottom in that range.


