

The PUMP token is currently experiencing price tightness beneath a descending trendline, coinciding with the introduction of an innovative cashback model that aims to alter trader dynamics.
Summary
- PUMP is showing compression beneath a descending trendline following a brief recovery phase.
- The newly introduced Cashback Coins feature at Pump.fun reallocates fee rewards away from creators and towards traders.
- A breakthrough from this current price range could signal expansion, while a failure to rise maintains the potential for downside risk.
As of the latest update, Pump.fun’s native token, PUMP, is trading at approximately $0.002162, reflecting a decrease of 3.2% over the last 24 hours. In the preceding week, the token has fluctuated between $0.001843 and $0.002355, positioning the current price closer to the upper limit of this range.
Despite a weekly increase of 13%, the token has experienced a decline of around 15% over the past month. However, trading activity has surged, with spot volumes peaking at $110 million within the last 24 hours—a significant 56% increase compared to the previous day.
Similarly, the derivatives market is witnessing heightened activity. Data from CoinGlass indicates that futures volume rose by 38% to $234 million, while open interest experienced a slight uptick of 1.08%, reaching $174 million.
The rising trading volume, coupled with the marginal increase in open interest, suggests that new positions are being established, albeit with moderate leverage growth.
Introduction of Cashback Coins – A New Incentive Model
The observed price compression is linked to Pump.fun’s recent overhaul of its launch model. Announced on February 17, the Cashback Coins feature allows creators to choose between traditional creator fees or redirecting those fees entirely towards traders and holders. This choice must be made prior to the token’s launch and cannot be altered afterward.
Creator Fees need change. Not every token deserves Creator Fees.
Now, users have the ability to decide whether a token truly deserves Creator Fees, or whether it makes more sense to reward the traders engaging with the token.
Cashback Coins are now live. Learn more 👇 pic.twitter.com/UbYoAbQ1Ya
— Pump.fun (@Pumpfun) February 17, 2026
Under the Cashback model, it is the traders and market participants who receive the creator fees, rather than the token deployers. This shift addresses criticisms concerning deployers who collect fees without delivering substantial long-term value to the ecosystem.
This structural change could significantly influence trading behavior in the short term. With rewards linked explicitly to trading activity rather than passive holding, increased volume can lead to higher fee generation and subsequent redistribution. This setup encourages rapid trading turnover and speculative bursts, which may result in amplified volatility as traders strategically enter and exit positions to maximize their rewards.
Technical Analysis of PUMP Price
Examining the daily chart, PUMP finds itself trading beneath a distinctly visible descending trendline, traced from a previous swing high. This pattern showcases a series of lower highs, while the lows have begun to stabilize around the $0.0021 mark. Currently, PUMP is navigating within a compression zone between support at $0.0021 and resistance at $0.0023.
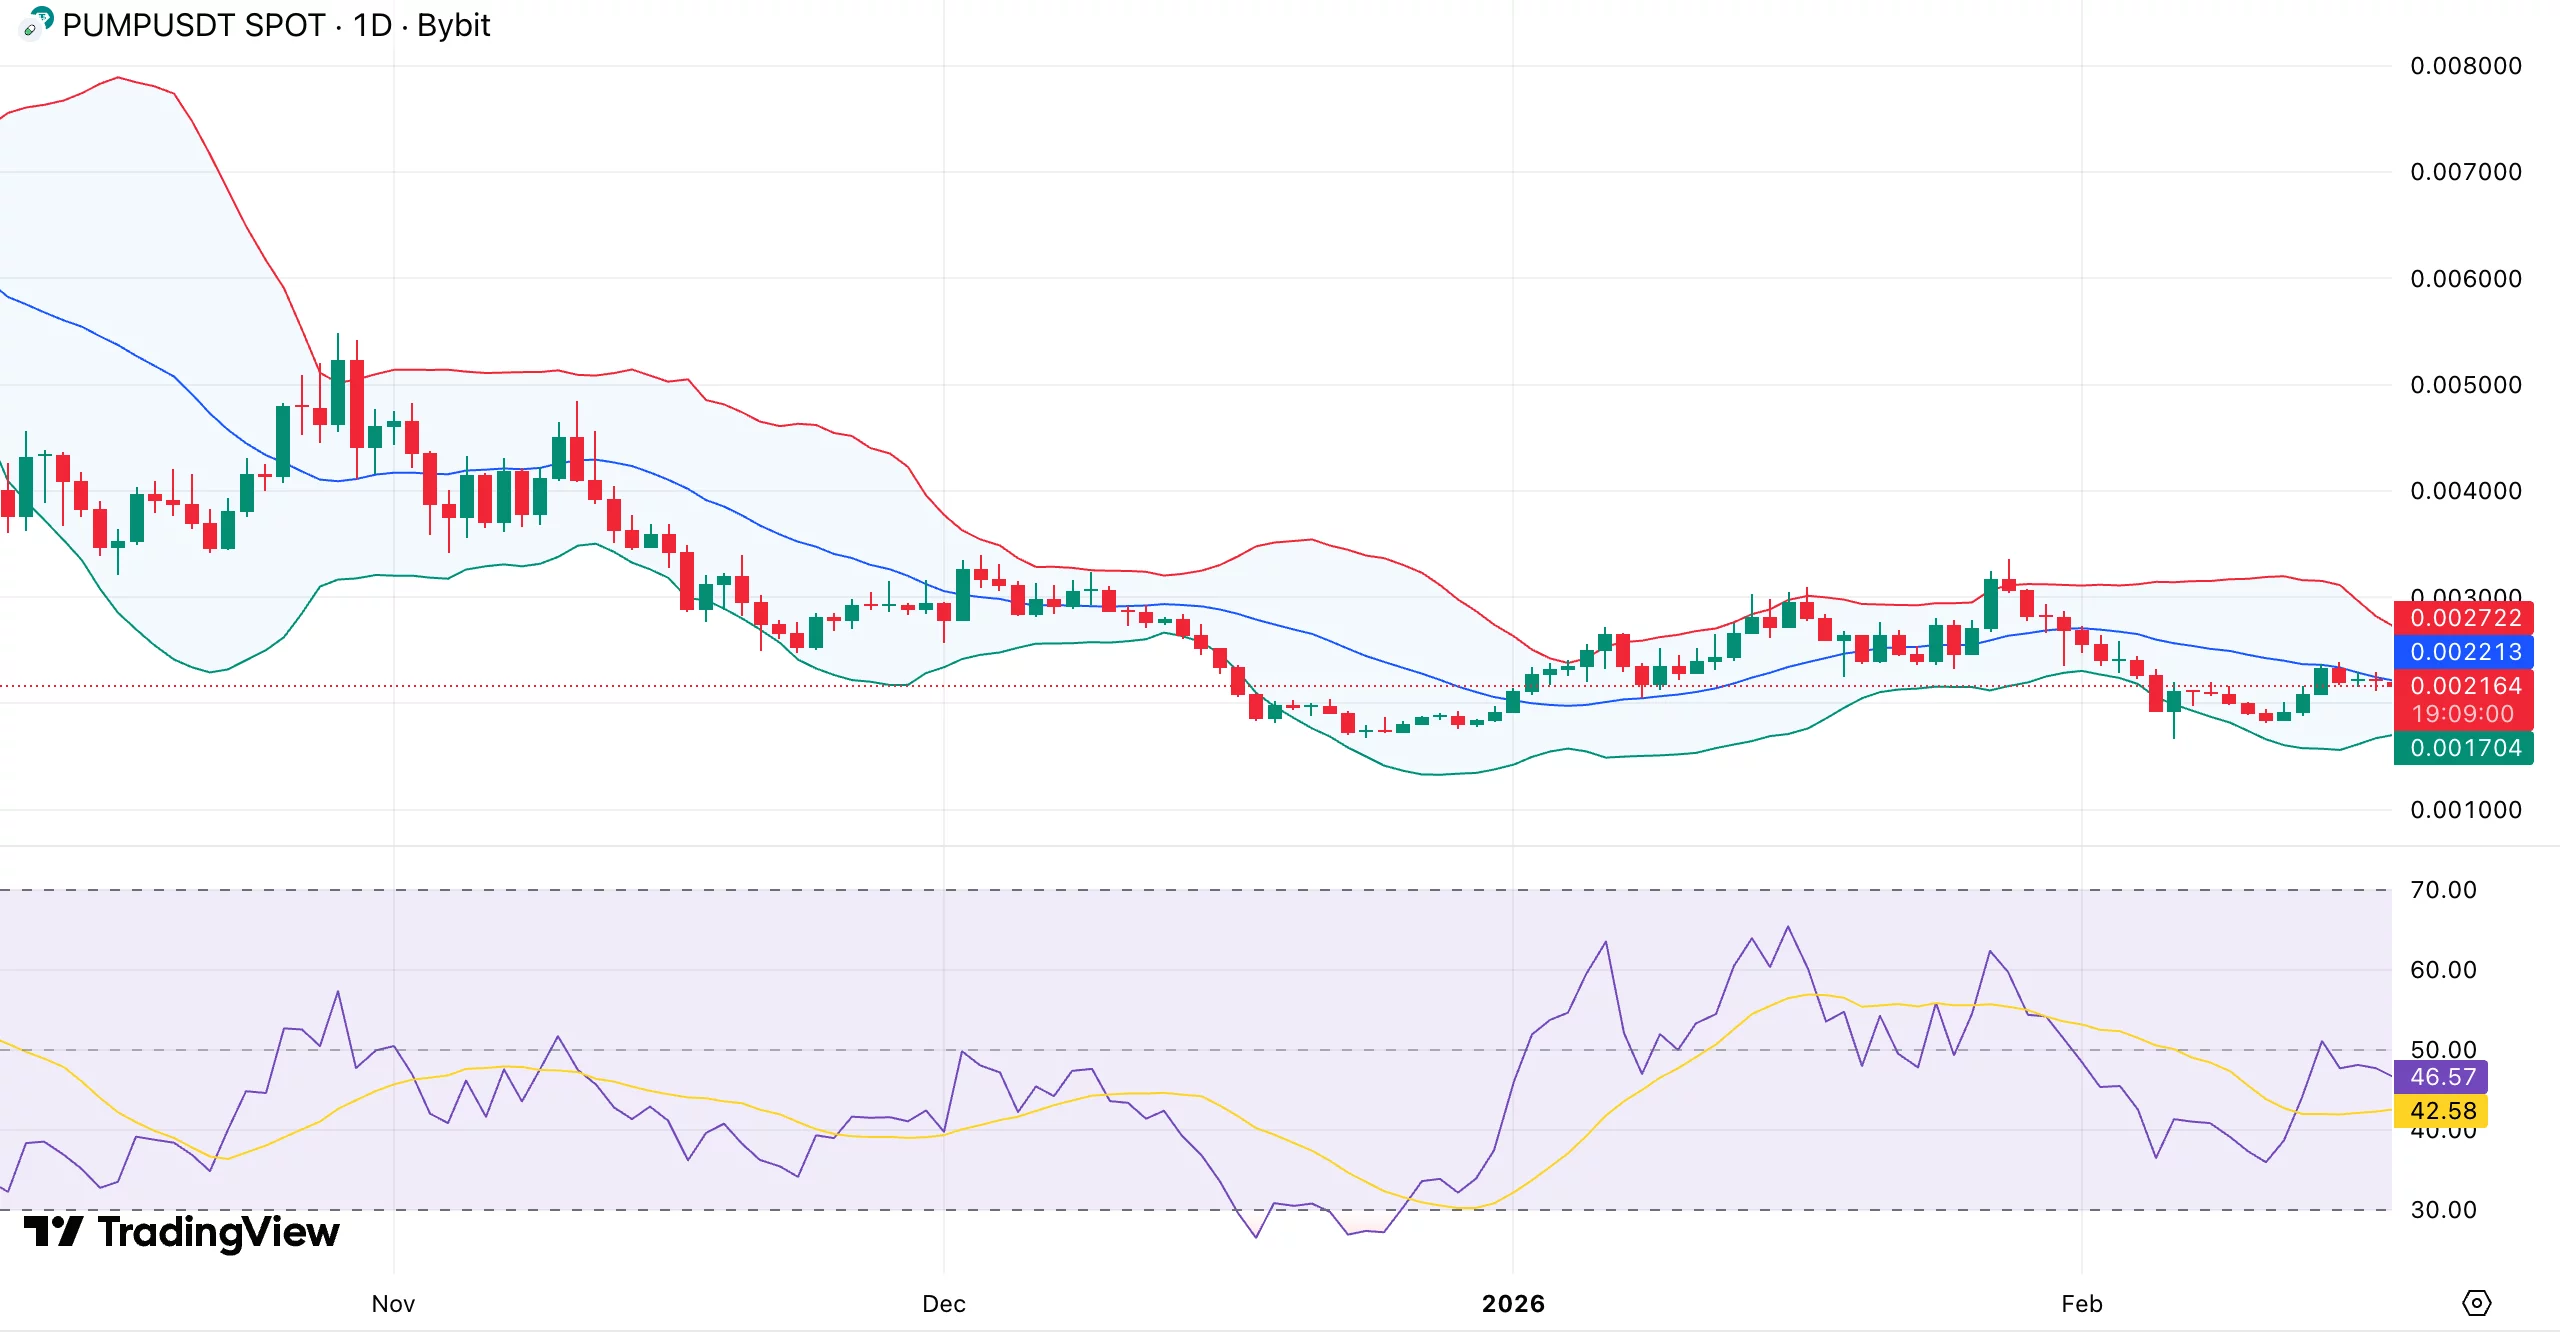
The tightening of Bollinger Bands indicates a contraction in volatility, a pattern that typically precedes an expansion phase. The direction of this future movement will hinge on the level that breaks first.
While momentum has shown signs of improvement, it has yet to turn fully bullish. The relative strength index is currently situated near 45, having rebounded from lower levels earlier in the month but remaining under the 50 mark, indicating that buyers have yet to seize control.
A sustained rally beyond 50 would bolster upside momentum. For traders to regain a footing, a close above the descending trendline and the 20-day moving average is essential, ideally accompanied by a substantial increase in trading volume.
Immediate resistance is found around $0.0023. A successful breakout above this threshold may trigger an upward movement towards the recent high of $0.002355. Conversely, a conclusive decline below $0.0021 could expose a lower liquidity pocket, shifting the momentum back to sellers.


