Bitcoin has historically displayed a cyclical price pattern characterized by rapid surges followed by significant pullbacks. Each successive bull market has resulted in diminishing returns—measured as lower percentage gains compared to past cycles. This evolving narrative raises a critical question: Will the current cycle adhere to these historical trends, or could Bitcoin’s maturation as a mainstream asset class alter its trajectory?
Bitcoin Price Trends and Diminishing Returns
This cycle has exhibited a remarkable growth of approximately 630% since its lowest point, which stands in sharp contrast to the more than 2,000% increase experienced in the preceding bull market. For Bitcoin to replicate the magnitude of the last cycle, it would need to surge to around $327,000—a target that increasingly appears ambitious.
Shifts in Bitcoin Price Dynamics
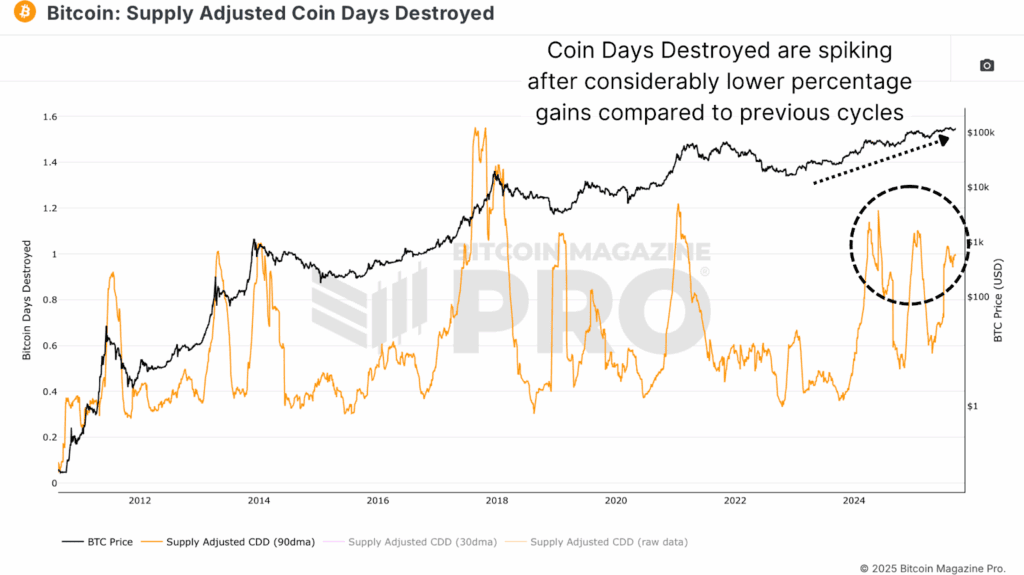
One significant factor contributing to these tempered gains can be observed through the Supply Adjusted Coin Days Destroyed (CDD) metric, which gauges the activity of older coins on the blockchain. During previous cycles, like the 2021 bull market, holders were inclined to sell after witnessing price increases of around 4x from their local lows. However, this cycle’s profit-taking has begun happening after only 2x moves. Notably, recent spikes in CDD have occurred with smaller price hikes of just 30–50%. This shift showcases a more sophisticated investor demographic, with long-term holders more inclined to secure profits earlier, thus smoothing out market volatility.
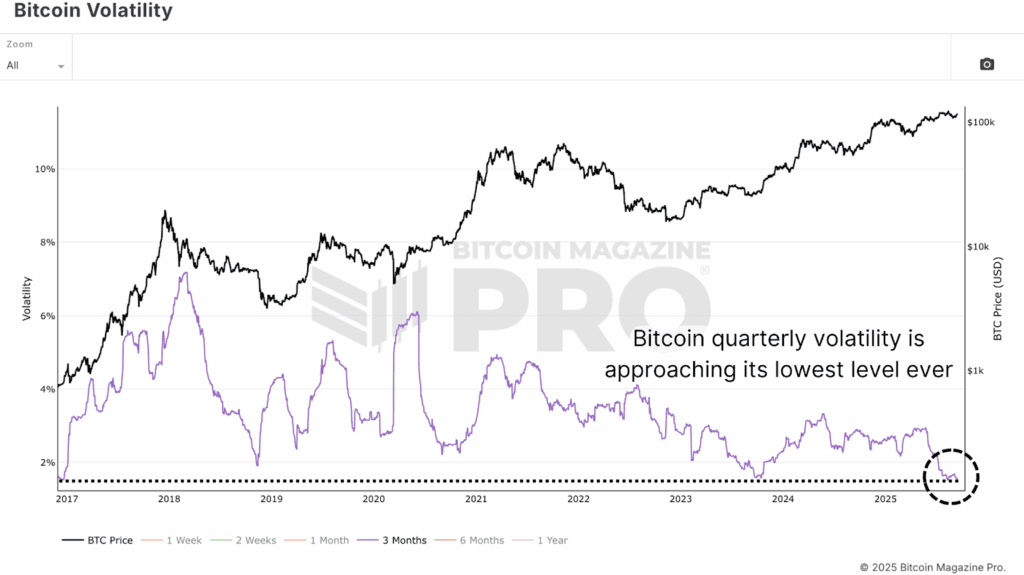
Additionally, Bitcoin’s volatility has shown a consistent decline. While this reduction decreases the likelihood of extreme price surges, it fosters a more stable long-term investment landscape. A lower volatility environment means that greater capital inflows are needed to push prices up, but this condition also makes Bitcoin more appealing to institutional investors seeking substantial risk-adjusted returns.

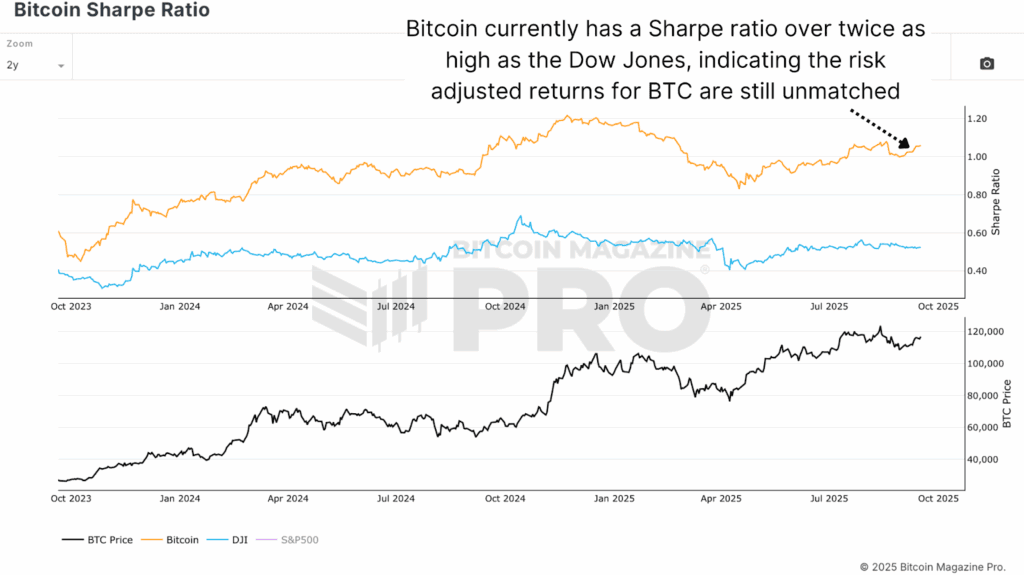
This trend is also evident in the Bitcoin Sharpe Ratio, which is currently more than double that of the Dow Jones Industrial Average. This indicates that Bitcoin continues to deliver superior returns relative to the risks involved, even amidst a phase of stabilization in the market.
Bitcoin Price and the Golden Ratio Framework
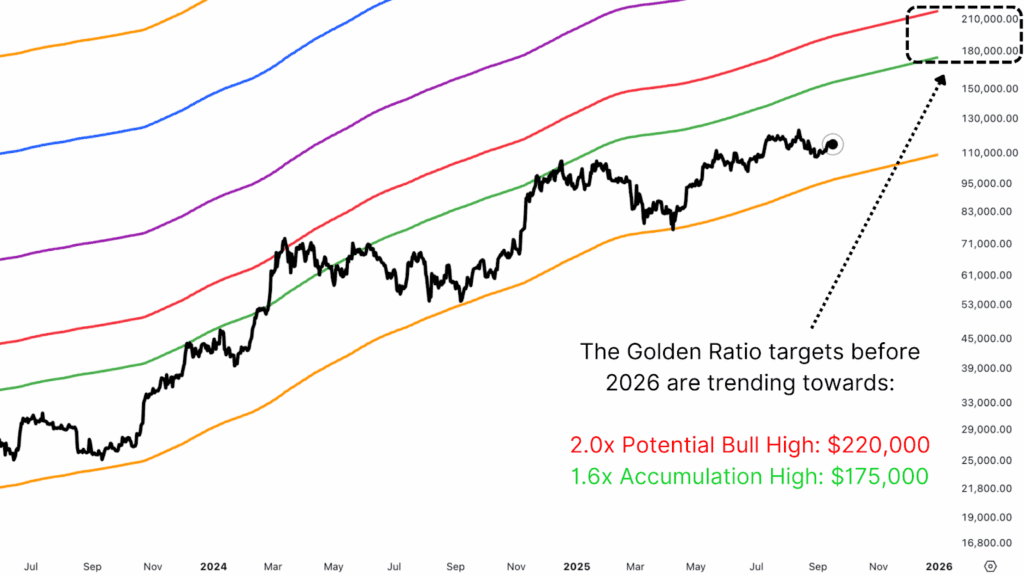
On a technical front, The Golden Ratio Multiplier provides valuable insights into the phenomenon of diminishing returns. Each market cycle peak has corresponded with progressively lower Fibonacci multiples of the 350-day moving average. In 2013, prices rallied to the 21x band. By the 2017 peak, this reduced to the 5x band, and during 2021, only the 3x band was reached. Currently, this cycle has touched the 2x and 1.6x bands, suggesting a potential return to the 2x levels may still be on the horizon.
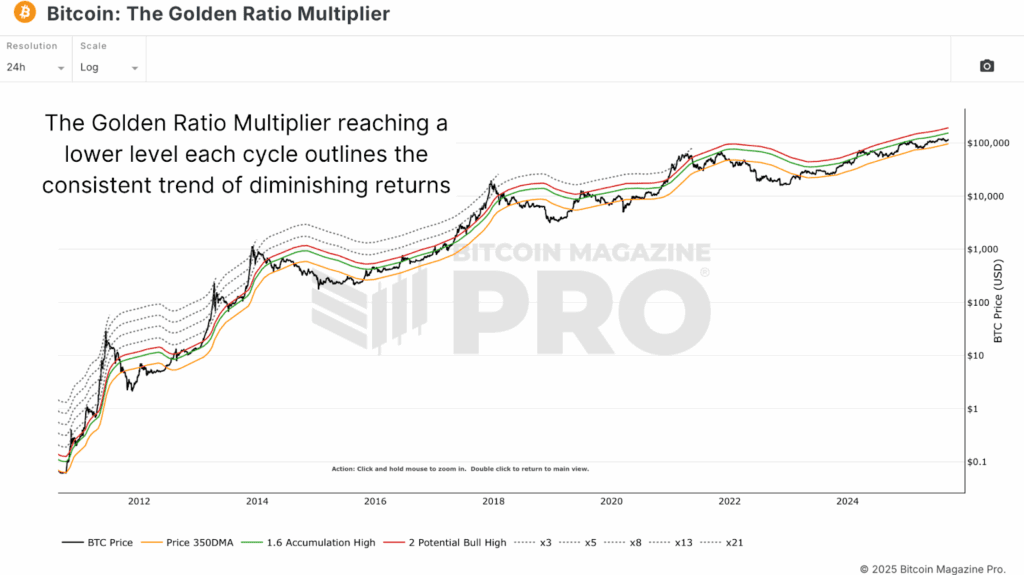
Extrapolating from these 1.6x and 2x levels indicates potential price targets in the range of $175,000 to $220,000 before year’s end. However, real market behavior will vary, and as Bitcoin approaches these upper targets, the 350DMA is anticipated to rise exponentially. Thus, these target levels are dynamic and will readjust as the bull cycle continues.
Bitcoin in a Transformative Phase
Despite the trend of diminishing returns, Bitcoin’s appeal remains strong, particularly for institutional investors. The reduced severity of price corrections, the potential for elongated market cycles, and enhanced risk-adjusted returns significantly bolster Bitcoin’s investment case. While the era of extreme percentage gains may be waning, the emerging phase of Bitcoin as a staple in institutional portfolios is just beginning, poised to deliver extraordinary returns in the forthcoming years.
For more insights, data, and detailed analyses on Bitcoin price trends, visit BitcoinMagazinePro.com.
Subscribe to Bitcoin Magazine Pro on YouTube for expert market insights and analysis!

Disclaimer: This article is for informational purposes only and should not be considered financial advice. Always conduct your own research before making any investment decisions.


