
Ethereum has recently been in a state of stagnation, leading traders to speculate about the reasons for this momentum stall despite several attempts at upward movement. According to a recent analysis shared on X, it appears the answer is tied to a particular technical level that Ethereum has struggled to reclaim.
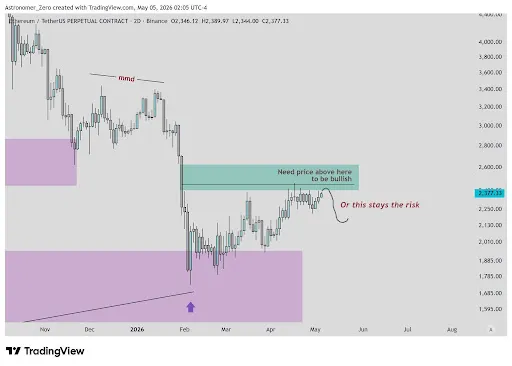
Ethereum’s $2,450 Resistance Level
The recent trading patterns of Ethereum can be linked to its interaction with a resistance zone near $2,450. An analyst has highlighted that this level served as a crucial point of confirmation for bullish momentum back in early May. The analysis suggested that if Ethereum could surpass the $2,450 mark, even momentarily, it would indicate a genuine breakout from the current range.
Related Reading
At the time, a chart shared by the analyst indicated this price zone as a critical reclaim area. The premise was that clearing such a level would serve as a strong directional signal for market participants. The simplicity of the level meant that even a quick push above it could validate bullish momentum.

However, the analyst urged caution until this threshold was decisively crossed. The logic was clear: markets often test major breakout levels but can reverse if buying pressure is insufficient to maintain a rally. The persistent hesitation at $2,450 indicated that the upward trend could still falter if the market failed to overcome this barrier.
This situation also correlated Ethereum’s price action to Bitcoin’s, drawing parallels between Ethereum’s $2,450 resistance level and a significant resistance area around $81,000 for Bitcoin. A confirmed breakout above the Ethereum threshold would likely bolster confidence throughout the broader cryptocurrency market.
Rejection at the Resistance Level Indicates Downside Risk
Shortly after the analysis was published, Ethereum’s price action confirmed the concerns raised. The cryptocurrency approached the resistance level but failed to establish a convincing break above it. Even though the market made attempts to test this area, it didn’t produce the decisive momentum required for a successful reclaim.

Following this rejection, the anticipated bearish scenario materialized, and Ethereum began to decline, reinforcing the notion that the resistance level had remained unbroken. Subsequent analysis indicated prices drifting away, suggesting further downside if the market continued to lose favorable momentum.
Related Reading
This outcome also correlated with Bitcoin’s price movements. The failure of Ethereum to assert strength at the vital resistance level hinted at weakening across the entire market structure. This correlation informed a short trading strategy on Bitcoin around $82,300, based on the expectation that both assets would experience downward movements together.
From a technical standpoint, Ethereum currently appears to be in a distribution phase below the resistance area and is struggling to generate adequate trading volume for a breakout. Until it decisively reclaims the $2,450 level, the analysis suggests that the market may remain susceptible to continued pullbacks. Effectively, the $2,450 mark has become a critical divide between the potential for renewed upward momentum and ongoing downside risks.

Featured image from Dall.E, chart from TradingView.com


