
As of June 5, Dogecoin’s price has experienced a notable downturn, trading around $0.086 after a 4.48% decline in just 24 hours and a staggering 25.25% drop over the past month.
Summary
- Dogecoin is currently testing the critical support level at $0.085 after a significant 25% loss in the previous month amidst continuing market weakness.
- Analyst Ali Martinez anticipates a potential recovery towards $0.1019 and $0.1156 if the channel support remains intact.
- Data from Coinglass highlights a decline in futures volume and open interest, whereas options activity has surged sharply.
Dogecoin Price Struggles Below $0.10
According to recent price data from crypto.news, Dogecoin is trading at approximately $0.086. Within the last 24 hours, the meme coin has fluctuated between a low of $0.086 and a high of $0.091, maintaining its position at the lower end of this range.
This recent decline has kept Dogecoin firmly below the critical $0.10 to $0.12 region that acted as a support level earlier in the month. After a significant 12.98% drop over the past week and an alarming 54.78% fall year-to-date, DOGE’s market dynamics appear increasingly bearish.
Currently, Dogecoin is a considerable distance from its all-time high of $0.731578 established on May 8, 2021, with a market capitalization of $13.34 billion, securing its spot as the 11th largest cryptocurrency by value. The circulating supply rests at approximately 154.52 billion DOGE, nearing its total supply due to ongoing mining activities.
Potential Recovery Zone Identified by Analysts
Renowned analyst Ali Charts has pointed out that Dogecoin has reached a key target of $0.0883 and is now probing the lower boundary of a descending channel, which is aligned closely with current pricing. This has become a crucial short-term focus for traders.
“As long as this support holds, I believe a recovery toward $0.1019 and $0.1156 is possible,” stated Ali, linking the near-term recovery potential directly to this critical support level.
However, Ali also cautioned that a breakdown from this level could expose further downside, targeting the next significant supply zone around $0.067, indicating a further descent from current prices and a continuation of the downtrend.
This perspective contrasts starkly with June 1, when Ali noted that the TD Sequential indicator had flashed a buy signal based on support holding at $0.096, identifying $0.110 as a prospective target—a target that has since been lost.
Technical Indicators Point to Weak Momentum
Current technical indicators reflect continued weakness in momentum. The Relative Strength Index (RSI) is positioned at 21.72, with its moving average around 37.25, indicating that DOGE is firmly within oversold territory. This suggests persistent selling pressure.
While an oversold RSI can often signal potential rebound zones, the lack of a definitive upward turn in the indicator suggests that DOGE has not yet validated a momentum reversal.
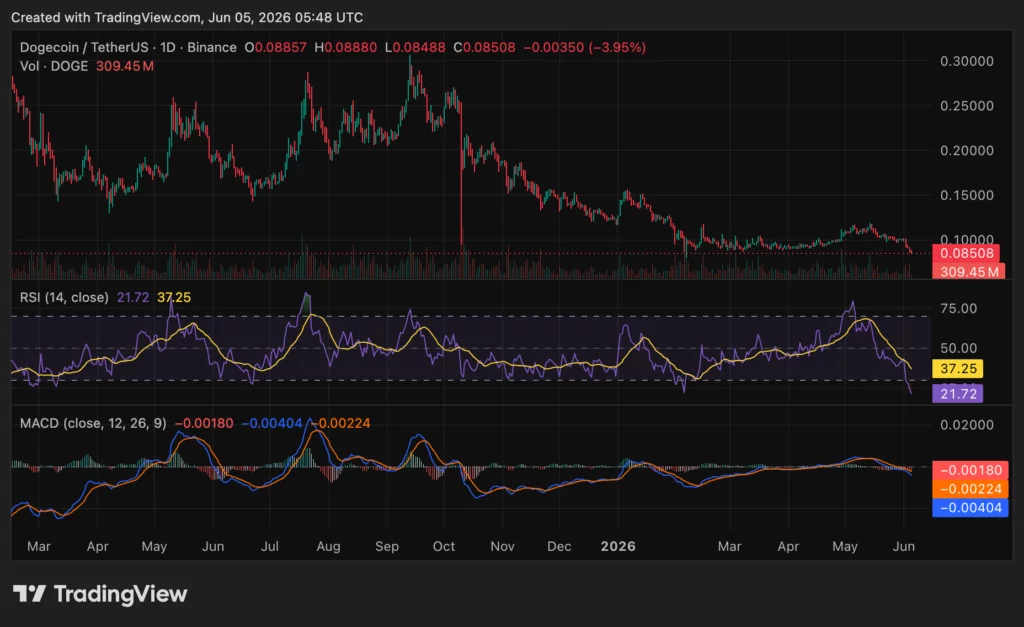
The Moving Average Convergence Divergence (MACD) similarly indicates bearish trends, with the MACD line at -0.00404, remaining below the signal line at -0.00224, while the histogram is at -0.00180. This setup confirms that sellers continue to dominate short-term momentum.
A successful reclaim of the $0.10 area is vital for improving the price outlook. A decisive move past $0.1019 would activate the first recovery target, while $0.1156 would serve as a test for the upper rebound zone highlighted by Ali Charts.
Derivatives Data Signal Risk Reduction Among Traders
Coinglass’s data indicates a notable 7.89% decrease in futures volume to $2.08 billion, accompanied by a 4.85% drop in open interest to $1.04 billion. These declines suggest a reduction in trader exposure as Dogecoin continues to slide.
The diminishing open interest during a selloff often reflects liquidation pressure or a withdrawal from leveraged positions, indicating weaker conviction among traders awaiting clearer signals.
Contrarily, options activity has spiked, rising 171.59% in volume, with open interest increasing by 42.23% to $600,650. This reflects that some traders are opting for options contracts even when the spot and futures markets face downward pressure.
This setup positions Dogecoin at a critical junction. Holding the $0.085 mark could facilitate a relief rally towards targets of $0.1019 and $0.1156. Conversely, losing this support would bring the next major downside target of $0.067 into focus for June trading.
Reports have framed Dogecoin’s position near a long-term CVDD value area, historically suggesting deep accumulation periods in prior cycles. Yet, to affirm any rebound efforts at this stage, DOGE requires increased spot demand and robust momentum.
This context is significant, given that the latest declines have pushed Dogecoin below the essential $0.10 to $0.11 range referenced in past analyses. Regaining this band would demonstrate that buyers are attempting to solidify their footing. Failure to do so would likely leave the chart skewed towards additional declines.
In summary, Dogecoin’s current price analysis emphasizes the importance of sustaining support levels and responding to trading volumes. Bulls must defend the $0.085 threshold and reclaim the $0.10 territory, while bears aim for a decisive close below the channel floor to maintain dominance, pushing DOGE toward lower support at approximately $0.067.
Disclosure: This article does not constitute investment advice. The content and materials presented herein are solely for educational purposes.
This article has been crafted to provide a comprehensive overview of Dogecoin’s current market performance and analysis, preserving the essential HTML structure for seamless integration into a WordPress platform.


